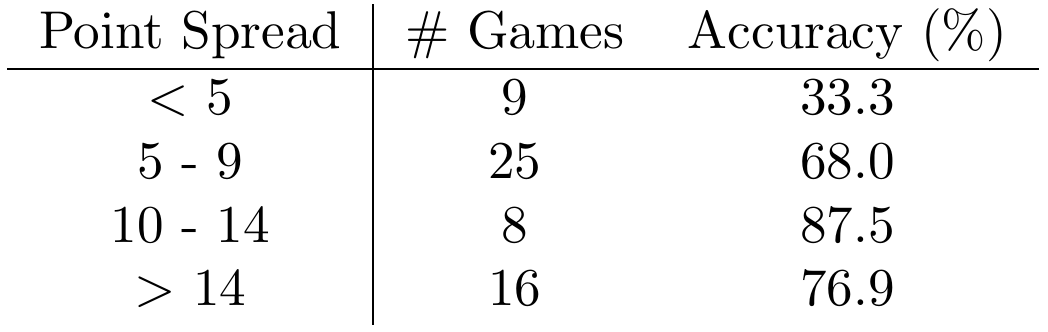
\(37/55 = 67.2%\) accuracy this week. Summary by point spread is at right.
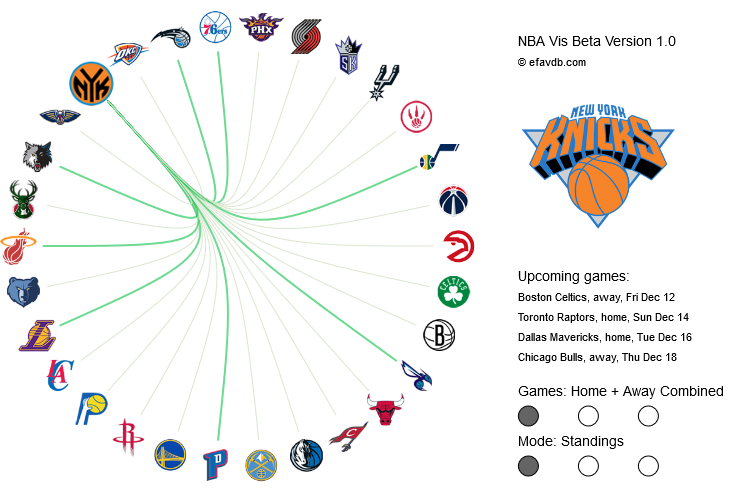
This week, we have posted a beta of our NBA dashboard. A screenshot is given below — the interactive version is linked to in our page’s header. We developed the tool using the programming language processing and displayed on the web using processing.js. Our thanks to Ann Hermundstad for introducing us to this tool, which we have really enjoyed! The wheel design of the dashboard was inspired by Jawbone’s correlated food visual, by Emi Nomura. We think this approach does a good job of quickly conveying the state of the league: both what has happened in prior games already, and what we think will happen in upcoming games.
Predictions for week 7 are now up. They can now also be viewed on the dashboard using the third “Mode”.
 Dustin got a B.S in Engineering Physics from the Colorado School of Mines (Golden, CO) before moving to UC Santa Barbara for graduate school. There he became interested in Soft Condensed Matter Physics and Polymer Physics, studying the interaction between single DNA molecules and salt ions. After a brief postdoc at UC San Diego studying the physics of bacterial growth, Dustin decided to move into the data science business for good - he is now a Quantitative Analyst at Google in Mountain View.